More than one command can be used to print messages to the Console panel of Chrome DevTools. Why is that? Well, some logging practices can be used to indicate the severity of the logged data. For instance, a Chrome error log that requires immediate fixing should stand out from the rest of the logs.
Diagnosed errors can be found in the Console panel, from which you should take the first steps towards JavaScript error handling. Other tabs of DevTools also play a role in the error-handling process, but more on that later.
The Console panel offers a set of features, designed for JavaScript error checking. With this Chrome tab, you can review all of the errors and inspect them.
Since the Console panel provides a lot of details about every Chrome error log, it is easy to implement in-depth analysis and find possible solutions. Therefore, if you notice issues on your website, exploit the functions in the Console panel to start JavaScript error handling.
In the Console panel, you can stop the execution of JavaScript at any moment. This feature is crucial for JavaScript error handling as you will be able to inspect the specific moment when the script goes wrong. Additionally, you are welcome to use the JavaScript error handler to collect data about runtime expressions.
Don’t let errors overshadow the purpose of your website: fix issues now!
Contents
JavaScript Error Handling: Main Tips
- In this tutorial, we explain how you can deal with various errors and exceptions that are logged to the Console panel.
- The Console allows you to track the errors and exceptions that pop up, so you can get details behind them and find the causes.
Error Handling Explained
JavaScript error handling combines the use of several panels of DevTools: Console and Sources.
Firstly, let's assume an error or exception has occurred on your page.
After noticing that there is something wrong, you may open the Console to inspect and find an error.
On the right side of the error log, you will notice its source (to which you can navigate). The source may be an URL or a line in one of the page's files.

It is also useful to know how the error's stack trace is viewed.
In the example below, stack frames, related to the error, are shown. You can easily navigate to them. As a result, you will understand the cause of the error better.

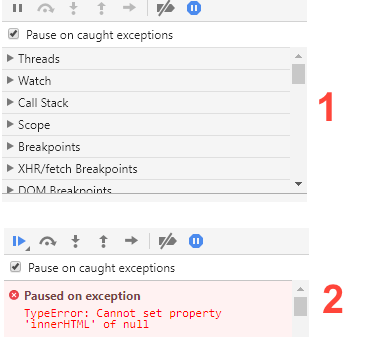
You also have the option to pause the execution of the code on exceptions.

These functions make the process of JavaScript error checking much smoother.
Usage of Stack Trace
Chrome Developer Tools allow you to inspect how websites work in more depth. Because you can review associated stack traces, the logs become more informative.
We will now look at the options for working with stack traces.
error.trace
Each error object has a string property named stack. This property contains the stack trace, which can tell you more about the source of the problem.

- Easy to use with a learn-by-doing approach
- Offers quality content
- Gamified in-browser coding experience
- The price matches the quality
- Suitable for learners ranging from beginner to advanced
- Free certificates of completion
- Focused on data science skills
- Flexible learning timetable

- Simplistic design (no unnecessary information)
- High-quality courses (even the free ones)
- Variety of features
- Nanodegree programs
- Suitable for enterprises
- Paid Certificates of completion

- A wide range of learning programs
- University-level courses
- Easy to navigate
- Verified certificates
- Free learning track available
- University-level courses
- Suitable for enterprises
- Verified certificates of completion
console.trace()
The console.trace() command makes the console print the current call stack. The command will let you see what's going on at key moments.
console.assert()
This command gives you more control, since using it allows you to set the conditions for errors. If the provided expression evaluates to false, an error message will be displayed.
Note: Read more about
console.assert()andconsole.trace()in our tutorial on the Console API.
Command to Find Runtime Exceptions
Another important subject we should cover is handling runtime exceptions.
To begin with, we should explain how the window.onerror handler function can help you implement JavaScript error handling. The command is meant for detecting issues that were not present during testing.
When a JavaScript exception gets thrown but is not caught by catch/try code clock, this function is invoked along with:
- A message related to the error.
- An URL of the resource that the exception originates from.
- The line of the resource in which the exception occurs.
These three are passed as three arguments (in the order shown above).

It is also possible to set a JavaScript error handler, which collects all of this error-related information. It can then be sent to the server using an AJAX POST call. Therefore, this command allows you to collect information about the runtime exceptions that users experience on your website.
JavaScript Error Handling: Summary
- This tutorial informed you of the ways the Console panel of Chrome DevTools can be used to manage errors and exceptions.
- The panel lets you implement detailed analyses about the diagnosed errors and exceptions. From such detailed investigations, developers are likely to debug errors faster.
 HTML
HTML  CSS
CSS  PHP
PHP  JavaScript
  SQL
SQL  Bootstrap
  Solidity
  jQuery
  Git
Git  Chrome DevTools
  C++
C++  Python


